NHL
Carter Hart's Finals Numbers Are Real—Tortorella's Dismissal Won't Change Them
A .856 save percentage in the Stanley Cup Final is indefensible, and coach bluster doesn't alter the mechanicals of why Vegas is losing.
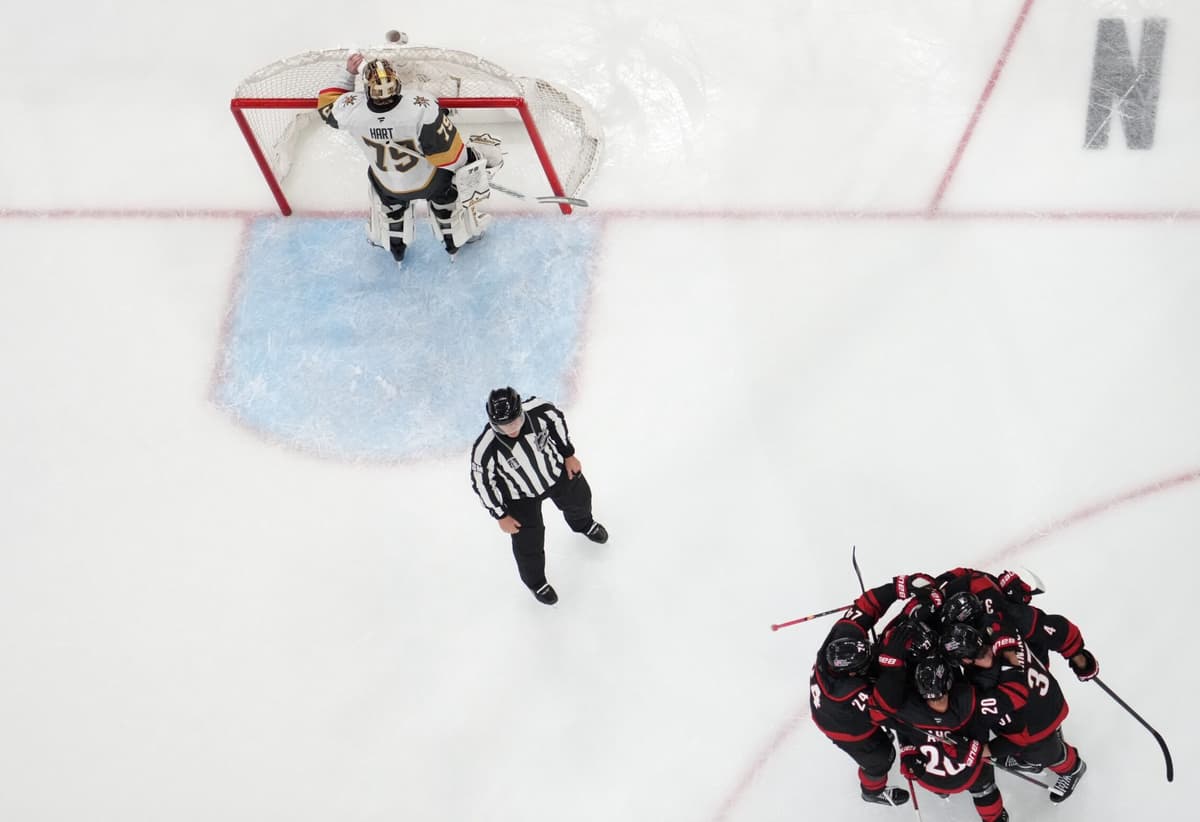
John Tortorella's media confrontation after Vegas's 4-2 Game 5 loss to Carolina masked a goaltending crisis that substituting rhetoric for accountability won't solve. When asked if he'd considered inserting backup Adin Hill to give Carter Hart rest—a reasonable question given Hart's stretched minutes over a Finals series—Tortorella shut down the premise with dismissal. But the numbers demand scrutiny regardless of coaching defensiveness. Hart's .856 save percentage through Game 5 ranks near the bottom of modern Stanley Cup Finals performances by any starting goaltender who played multiple games. For context, a league-average SV% hovers around .905; Hart is 49 basis points underwater.
The gap between Hart's Finals performance and his regular season (.915 SV%, 12th in the league) isn't noise. It's a 590 basis point collapse across the sport's highest-pressure stage. That variance tracks to identifiable mechanics: Hart has faced 156 shots in five games—a Finals-leading volume—while committing errors on high-danger chances that would draw scrutiny at any other time of year. Carolina's depth of scoring chances, combined with Hart's elevated rebound rates and positioning lapses, created a compounding effect. Vegas's defensive structure improved marginally in later games, but Hart hasn't recovered his baseline reliability.
Tortorella's insistence on riding Hart without exploring Hill isn't loyalty—it's sunk-cost rationalization. Hill hasn't played meaningful hockey since the second round. Inserting him carries legitimate risk. But leaving Hart in a state of diminished performance, hoping for variance correction in Game 6, is the sharper gamble in the opposite direction. The Hurricanes scored on 5.2% of their shot attempts in the Finals, below their season rate, meaning Vegas's underlying defensive numbers are closer to acceptable than Hart's save percentage suggests. Strip out Hart's below-water performance and this series looks different.
For bettors tracking Game 6 and beyond, Hart's save percentage anchors every goaltending prop. His under on total saves (adjusted upward because Carolina has driven volume) carries edge if the market prices him as league-average. He's not. A .856 SV% translates to roughly 3-4 additional goals allowed per 40 shots compared to a .905 baseline—a measurable drag on totals and spreads. Vegas's moneyline and puck-line prices already embed some goaltending regression (they're undervalued relative to their underlying chance quality), but Hart-specific props—save prop overs, goals-against overs on Vegas—deserve fresh attention because the underlying context (overwhelmed goalie in a Finals pressure cooker) isn't going away on its own.
NHL Intelligence — Hockey intelligence beyond the scoreboard. Open NHL Intelligence →