Hurricanes-Golden Knights Finals Matchup Sets Up Defensive Stalemate With Shutout and Under Props Front and Center
By Justin Erickson ·
Carolina's suffocating defense and Vegas's playoff goaltending form converge in a Stanley Cup Final that will be decided by marginal scoring opportunities and goalie execution.
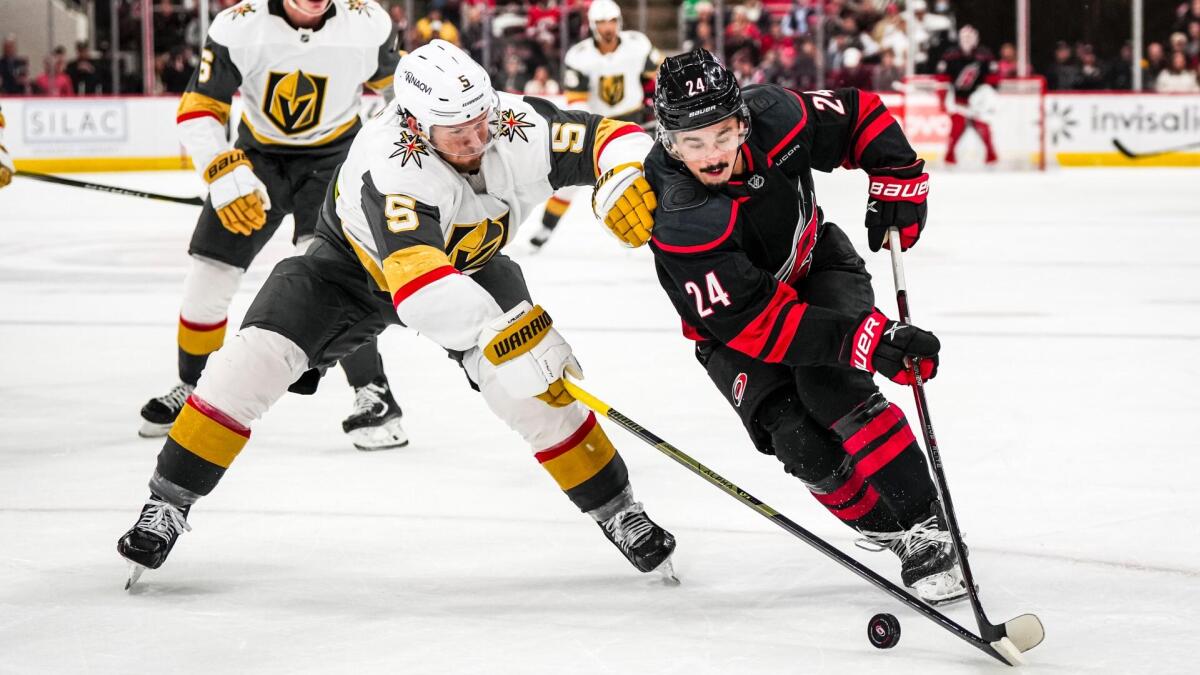
The Carolina Hurricanes and Vegas Golden Knights will meet for the Stanley Cup beginning June 2, both teams having punched through the Eastern and Western Conference Finals with dominant defensive records. Carolina arrives at 12-1 through three rounds, propelled not by secondary scoring depth but by a historically tight defensive structure—just 21 goals allowed and three shutouts from Frederik Andersen, who's posted a .931 save percentage. Vegas matches that intensity on the other end: 20 goals allowed in the last 10 games, with Carter Hart making the critical saves at .922 in the postseason after a mid-season acquisition.
The Hurricanes' offensive shape has tilted toward their secondary line. Taylor Hall, Logan Stankoven, and Jackson Blake have combined for 47 points in 13 games, which distributes the scoring load in a way that prevents Vegas from targeting a single star. Sebastian Aho and Seth Jarvis remain available as pressure releases, but Vegas's defensive infrastructure—anchored by Shea Theodore's game-reading and Brett Howden's physical presence—is built precisely to neutralize depth. On the Vegas side, Mitch Marner's arrival (21 playoff points, team-leading) has functioned as an offensive fulcrum, but the Golden Knights have leaned harder on completion percentage and transition efficiency than pure volume scoring.
Both teams have defended the mid-slot and high-slot areas at elite rates, which means shot quality becomes the delimiter. Andersen faces roughly 27-30 shots per game in these playoffs; Hart similarly operates in the 28-32 range. Neither team is generating offense through volume—Carolina's second line is creating scoring without generating the 35+ shot nights that typically precede Finals blowouts. This structural similarity (strong third-pair D, penalty-kill specialists, depth forwards who complement rather than dominate) points toward a series where total goals per game settle below season-long trends.
The prop angle tracks directly: Andersen's shutout equity is overstated in the betting market because his .931 SV% masks the fact that Vegas's shot volume against him will be suppressed by Carolina's forecheck intensity. Conversely, Hart's .922 rate benefits from Vegas's defensive positioning, not goalie excellence alone—Carolina will test him more than most Vegas opponents have, but the Hurricanes' shot-generation profile (47% of scoring from their second line) means fewer Grade-A looks. Game-level totals under the season average (5.2 goals per game) carry value if priced above that mark. Series unders (fewer than 28 total goals across seven games) are the more durable play because the matchup structure doesn't change—both teams defend the same way regardless of game score.
Bettors pricing Andersen shutout props should discount for Vegas's playoff offensive consistency and depth; his three shutouts in 16 playoff games is a rate unlikely to sustain when facing an opponent this structured. Under totals on individual games become viable at the open, before sharp action compresses spreads and totals together.