NFL
Week 4 NFL Model Projects Tight Spreads and Machine-Generated Cover Rates—Here's Where the Real Edge Sits
A predictive model running 10,000 simulations per game reveals consensus spreads with razor-thin cover probabilities; the angles that matter are the ones where simulation confidence diverges from market consensus.
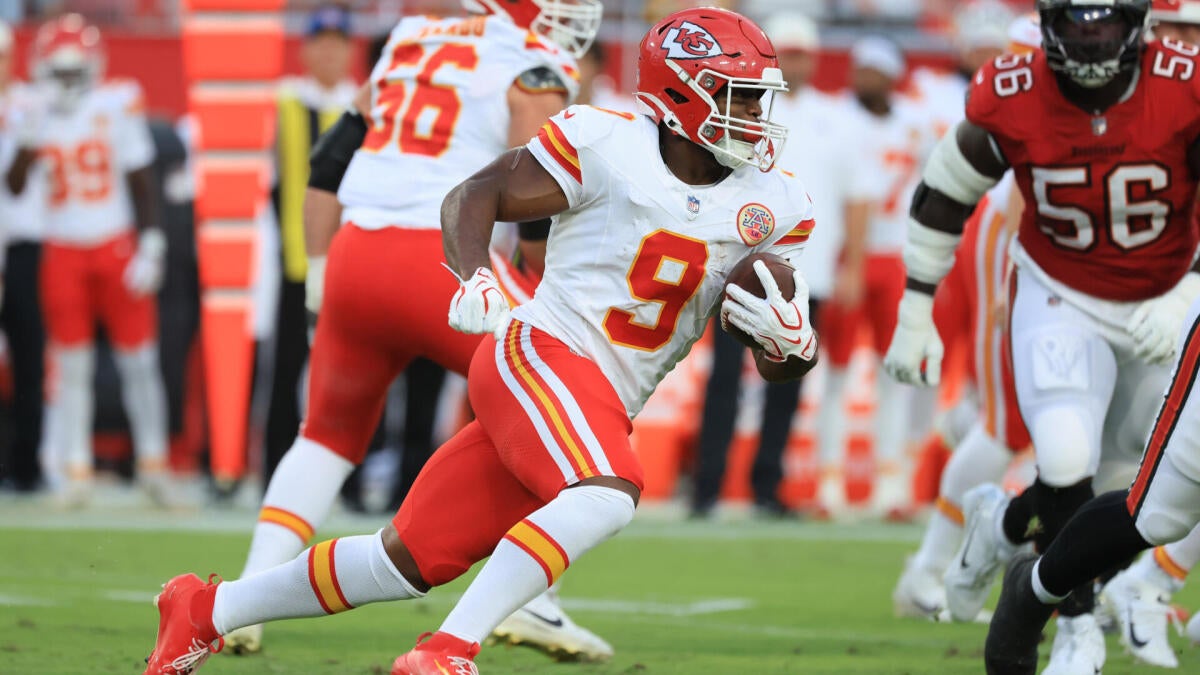
The SportsLine Projection Model has released its Week 4 NFL forecasts across a full Sunday slate, generating point-spread predictions and cover probabilities for all matchups. The output is voluminous: Texans favored by 2.5 at home over Dallas (66% cover rate in simulation), Ravens laying 11.5 against Tennessee (56% cover rate), Bears favored by 3.5 over the Jets (67% cover rate). On the surface, this is standard pre-game predictive work—simulate each matchup 10,000 times, aggregate the outcomes, publish the median score and win probability.
But the real information lives in the gap between cover rate and line movement. When a model projects 67% confidence in a Bears cover at minus-3.5, that is materially different from the 52-55% range the market typically bakes into a 3.5-point line. The difference is not noise. A 15-percentage-point divergence between simulation and public consensus—what you'd see comparing the Bears or Vikings (66%) to the Bills (52%)—suggests either the model has detected something the market has repriced away, or the market is irrational at that specific line. The 2024-2025 NFL seasons have repeatedly shown that low-margin cover rates (50-52% range) on favorites with four-plus point spreads are vulnerable to sharp money stepping in on the dog; conversely, 65%+ confidence in a favorite almost always reflects a matchup asymmetry the public underweights.
The Ravens-Titans pairing deserves scrutiny. Baltimore is laying 11.5 at home—a punitive number for Week 4—yet the model assigns only 56% confidence to the cover. That is a red flag. An 11.5-point spread typically prices in 60%+ moneyline equivalent probability; if the model sees only 56%, the implication is that Tennessee's implied 41.5% win probability may actually be closer to 44%. The four-point discrepancy is small, but it compounds across NFL betting markets where 1-2% shifts in true probability often precede line movement. The inverse example: Vikings-Dolphins at minus-11.5 with 66% model confidence. Here, Minnesota's structural advantages (defensive pace, turnover differential, playoff-caliber talent) likely justify the market's aggressive line. The model reinforces the spread rather than undermining it.
Texans-Cowboys is the most heavily trafficked game on the slate, and the 2.5-point line with 66% Houston confidence represents a rare alignment between model conviction and spread geometry. Two and a half points is a natural closing number in the NFL; bettors accustomed to seeing 55-57% probability on three-point lines should note that 66% on 2.5 is structurally similar. The real angle here is not the spread but the totals and player props. If the model is 66% confident in Houston's win, that confidence likely stems from offensive efficiency or defensive red-zone performance. Texans team totals and individual passing/rushing lines should be favored relative to preseason projections—not because of one model run, but because the model's high conviction suggests the underlying efficiency metrics have not yet been fully priced into player props. A quarterback with Houston's projected 32-point ceiling in a 2.5-point favorite role typically sees his passing-yard line inflated relative to his true season expectation; market makers build in a comfort buffer on spreads but tighten that buffer on player lines, creating occasional mispricings.
The betting takeaway is tactical: avoid chasing model cover rates below 53% on favorites of three points or more, as those represent market-model disagreement and often resolve in favor of the market over the next 48-72 hours as sharper public perception catches up. Conversely, when model confidence exceeds 64% on a spread wider than three points, the structural advantage is real and tends to persist through kickoff. Use the Ravens and Vikings as barometers—not because the model says so, but because consensus divergence between model and spread probability is the only durable signal in a batch of weekly predictions. The individual score projections themselves (Texans 32, Cowboys 23, etc.) are useful for totals calibration but should never be used directly as spread picks; aggregate models drift toward chalk and miss tail-risk scenarios that sharp markets price in from the start.
NFL Intelligence — Football intelligence beyond the final score. Open NFL Intelligence →