Wood's Historic Run-Scoring Pace Tests All-Star Break Narrative
By PropBetEdge Editorial Team ·
James Wood has built a 21-run cushion on the second-place finisher by the All-Star break—the widest lead in MLB history at this checkpoint—raising questions about whether late-season competition intensity will compress or sustain his outlier pace.
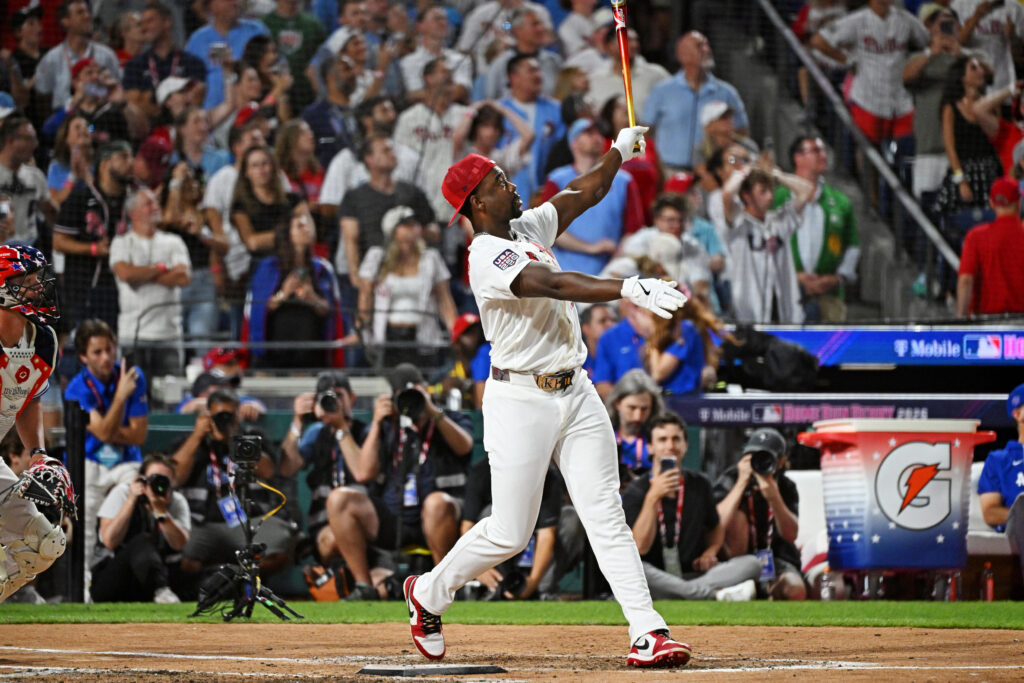
James Wood enters the All-Star break with 89 runs scored, a 21-run lead over Pirates outfielder Bryan Reynolds' 68—the largest run-scoring gap the league has ever seen at the break, per the Nationals organization. The statistical milestone demands immediate context: Wood is performing in a role and lineup that has produced elite offensive environment scores, but the remaining half-season will test whether his pace reflects sustainable elite performance or a first-half spike driven by favorable sequencing and competition variance.
Wood's 89 runs in roughly 90 games (the approximate All-Star break timeline) projects to roughly 162 runs over a full season—a number that would rank among the top five in a single season since 2000. The pathway to that total requires understanding what's driving the run pace. Runs scored correlate most heavily with on-base percentage, walk rate, and lineup protection. Wood's power profile (evident from his selection to the All-Star team) suggests he's generating hard contact and advanced positioning in high-leverage counts. Whether his early-season team has featured an unusual concentration of protection around him—hitters protecting him in the order, favorable pitcher matchups, or weak defensive positioning—matters significantly to prop modeling going forward.
The All-Star break represents a natural reset point. The second half introduces fresh playoff-oriented pitching strategies, bullpen adjustments, and defensive shifts calibrated to late-season sample sizes. Teams see Wood's run-scoring total and adjust their approach. Simultaneously, fatigue and September call-ups alter lineup composition. Projecting his final run total from the 89 already scored is a common mispricing angle: the market will likely extrapolate the 89-run pace linearly, but the structural conditions that generated that first-half rate rarely persist identically into October baseball.
For bettors, Wood's runs-scored prop for the second half becomes a fade candidate if the line assumes linear carry-forward. His total of 89 runs in 90 games would require 73 more runs in the final 72 games to hit 162 for the year—a maintenance of his exact first-half rate despite the seasonal and competitive headwinds noted above. If sportsbooks price his second-half runs total assuming his first-half pace continues without adjustment, that's an edge to short. The market hasn't yet absorbed that the All-Star break is when defenses, pitching strategy, and lineup composition all recalibrate to diminish exactly this type of first-half surplus performer.